import pandas as pd
from sklearn.model_selection import train_test_split
from sklearn.preprocessing import StandardScaler, OneHotEncoder
from sklearn.compose import ColumnTransformer
from sklearn.pipeline import Pipeline
from sklearn.linear_model import LogisticRegression
from sklearn.metrics import classification_report, confusion_matrix
import joblibSetup
Library Setup
Connect to Google Drive
from google.colab import drive

# Mount Google Drive to save the final model
print("Mounting Google Drive...")
drive.mount('/content/drive')
Mounting Google Drive...
Mounted at /content/driveData Setup
import kagglehub

# Download latest version
path = kagglehub.dataset_download("blastchar/telco-customer-churn")

print("Path to dataset files:", path)

# Define the full path to the CSV file
csv_path = "/kaggle/input/telco-customer-churn/WA_Fn-UseC_-Telco-Customer-Churn.csv"

# Load into a DataFrame
data = pd.read_csv(csv_path)
Path to dataset files: /kaggle/input/telco-customer-churnData Preparation
Data Exploration
data.head()| customerID | gender | SeniorCitizen | Partner | Dependents | tenure | PhoneService | MultipleLines | InternetService | OnlineSecurity | ... | DeviceProtection | TechSupport | StreamingTV | StreamingMovies | Contract | PaperlessBilling | PaymentMethod | MonthlyCharges | TotalCharges | Churn | |
|---|---|---|---|---|---|---|---|---|---|---|---|---|---|---|---|---|---|---|---|---|---|
| 0 | 7590-VHVEG | Female | 0 | Yes | No | 1 | No | No phone service | DSL | No | ... | No | No | No | No | Month-to-month | Yes | Electronic check | 29.85 | 29.85 | No |
| 1 | 5575-GNVDE | Male | 0 | No | No | 34 | Yes | No | DSL | Yes | ... | Yes | No | No | No | One year | No | Mailed check | 56.95 | 1889.5 | No |
| 2 | 3668-QPYBK | Male | 0 | No | No | 2 | Yes | No | DSL | Yes | ... | No | No | No | No | Month-to-month | Yes | Mailed check | 53.85 | 108.15 | Yes |
| 3 | 7795-CFOCW | Male | 0 | No | No | 45 | No | No phone service | DSL | Yes | ... | Yes | Yes | No | No | One year | No | Bank transfer (automatic) | 42.30 | 1840.75 | No |
| 4 | 9237-HQITU | Female | 0 | No | No | 2 | Yes | No | Fiber optic | No | ... | No | No | No | No | Month-to-month | Yes | Electronic check | 70.70 | 151.65 | Yes |
5 rows × 21 columns
data.info()<class 'pandas.core.frame.DataFrame'>
RangeIndex: 7043 entries, 0 to 7042
Data columns (total 21 columns):
# Column Non-Null Count Dtype
--- ------ -------------- -----
0 customerID 7043 non-null object
1 gender 7043 non-null object
2 SeniorCitizen 7043 non-null int64
3 Partner 7043 non-null object
4 Dependents 7043 non-null object
5 tenure 7043 non-null int64
6 PhoneService 7043 non-null object
7 MultipleLines 7043 non-null object
8 InternetService 7043 non-null object
9 OnlineSecurity 7043 non-null object
10 OnlineBackup 7043 non-null object
11 DeviceProtection 7043 non-null object
12 TechSupport 7043 non-null object
13 StreamingTV 7043 non-null object
14 StreamingMovies 7043 non-null object
15 Contract 7043 non-null object
16 PaperlessBilling 7043 non-null object
17 PaymentMethod 7043 non-null object
18 MonthlyCharges 7043 non-null float64
19 TotalCharges 7043 non-null object
20 Churn 7043 non-null object
dtypes: float64(1), int64(2), object(18)
memory usage: 1.1+ MBWe see that all variables should be factors except for tenure, MonthlyCharges, and TotalCharges.
Data Quality
Non-Numeric Values in Numeric Columns
# These columns are numeric
numeric_cols = ['tenure', 'MonthlyCharges', 'TotalCharges']

print("Checking for non-numeric values in expected numeric columns...")
for col in numeric_cols:
    # Try to convert the column to a number
    original_nan_count = data[col].isnull().sum()
    # 'coerce' turns any problems into NaN
    converted_col = pd.to_numeric(data[col], errors='coerce')
    new_nan_count = converted_col.isnull().sum()

    # Check if any new NaNs were created
    if new_nan_count > original_nan_count:
        print(f"  - WARNING: Column '{col}' contains non-numeric values.")
        # Find the problematic rows by comparing the original to the converted column
        problem_rows = data[converted_col.isnull() & data[col].notnull()]
        print(f"    Found {len(problem_rows)} problematic entries. \n\nExample:")
        print(problem_rows.head())
    else:
        print(f"  - OK: Column '{col}' appears to be clean.")
Checking for non-numeric values in expected numeric columns...
- OK: Column 'tenure' appears to be clean.
- OK: Column 'MonthlyCharges' appears to be clean.
- WARNING: Column 'TotalCharges' contains non-numeric values.
Found 11 problematic entries.
Example:
customerID gender SeniorCitizen Partner Dependents tenure \
488 4472-LVYGI Female 0 Yes Yes 0
753 3115-CZMZD Male 0 No Yes 0
936 5709-LVOEQ Female 0 Yes Yes 0
1082 4367-NUYAO Male 0 Yes Yes 0
1340 1371-DWPAZ Female 0 Yes Yes 0
PhoneService MultipleLines InternetService OnlineSecurity ... \
488 No No phone service DSL Yes ...
753 Yes No No No internet service ...
936 Yes No DSL Yes ...
1082 Yes Yes No No internet service ...
1340 No No phone service DSL Yes ...
DeviceProtection TechSupport StreamingTV \
488 Yes Yes Yes
753 No internet service No internet service No internet service
936 Yes No Yes
1082 No internet service No internet service No internet service
1340 Yes Yes Yes
StreamingMovies Contract PaperlessBilling \
488 No Two year Yes
753 No internet service Two year No
936 Yes Two year No
1082 No internet service Two year No
1340 No Two year No
PaymentMethod MonthlyCharges TotalCharges Churn
488 Bank transfer (automatic) 52.55 No
753 Mailed check 20.25 No
936 Mailed check 80.85 No
1082 Mailed check 25.75 No
1340 Credit card (automatic) 56.05 No
[5 rows x 21 columns]Missing Value Summary
# Clean 'TotalCharges'
print("Performing final check for missing values after cleaning...")
data['TotalCharges'] = pd.to_numeric(data['TotalCharges'], errors='coerce')

missing_values = data.isnull().sum()
# Filter to only show columns with missing data
missing_values = missing_values[missing_values > 0]

# Do a final check for any NaNs
if missing_values.empty:
    print("  - SUCCESS: No missing values found in any columns after cleaning.")
else:
    print("  - WARNING: Missing values found in the following columns:")
    print(missing_values)

# Drop rows with any missing values
data.dropna(inplace=True)
Performing final check for missing values after cleaning...
- WARNING: Missing values found in the following columns:
TotalCharges 11
dtype: int64There were only 11 rows where TotalCharges was missing, so I drop them.
Unique Values in Categorical Columns
# Get a list of all columns of type 'object'
categorical_cols = data.select_dtypes(include=['object']).columns

print("\n[INFO] Inspecting unique values in categorical columns...")
for col in categorical_cols:
    # Ignore 'customerID' as its values are all unique
    if col != 'customerID':
        unique_values = data[col].unique()
        print(f"  - Column '{col}' has {len(unique_values)} unique values: {unique_values}")
[INFO] Inspecting unique values in categorical columns...
  - Column 'gender' has 2 unique values: ['Female' 'Male']
  - Column 'Partner' has 2 unique values: ['Yes' 'No']
  - Column 'Dependents' has 2 unique values: ['No' 'Yes']
  - Column 'PhoneService' has 2 unique values: ['No' 'Yes']
  - Column 'MultipleLines' has 3 unique values: ['No phone service' 'No' 'Yes']
  - Column 'InternetService' has 3 unique values: ['DSL' 'Fiber optic' 'No']
  - Column 'OnlineSecurity' has 3 unique values: ['No' 'Yes' 'No internet service']
  - Column 'OnlineBackup' has 3 unique values: ['Yes' 'No' 'No internet service']
  - Column 'DeviceProtection' has 3 unique values: ['No' 'Yes' 'No internet service']
  - Column 'TechSupport' has 3 unique values: ['No' 'Yes' 'No internet service']
  - Column 'StreamingTV' has 3 unique values: ['No' 'Yes' 'No internet service']
  - Column 'StreamingMovies' has 3 unique values: ['No' 'Yes' 'No internet service']
  - Column 'Contract' has 3 unique values: ['Month-to-month' 'One year' 'Two year']
  - Column 'PaperlessBilling' has 2 unique values: ['Yes' 'No']
  - Column 'PaymentMethod' has 4 unique values: ['Electronic check' 'Mailed check' 'Bank transfer (automatic)'
 'Credit card (automatic)']
  - Column 'Churn' has 2 unique values: ['No' 'Yes']
Data Preprocessing
Feature Encoding
# Drop 'customerID' as it's just an identifier
data.drop('customerID', axis=1, inplace=True)

# Convert target 'Churn' to (0, 1)
data['Churn'] = data['Churn'].apply(lambda x: 1 if x == 'Yes' else 0)

# Separate the features from the target
X = data.drop('Churn', axis=1)
y = data['Churn']

# Separate categorical and numerical features
categorical_features = X.select_dtypes(include=['object']).columns
numerical_features = X.select_dtypes(include=['int64', 'float64']).columns

# Create a preprocessing pipeline
preprocessor = ColumnTransformer(
    transformers=[
        # Scale the numerical features
        ('num', StandardScaler(), numerical_features),
        # One-hot encode the categorical features
        ('cat', OneHotEncoder(handle_unknown='ignore'), categorical_features)
    ])

# Split the data into training and testing sets
X_train, X_test, y_train, y_test = train_test_split(X, y, test_size=0.2, random_state=42, stratify=y)
Building a Model
I choose to use logistic regression, as it is a simple but powerful model for classification.
Define Model
# Create the full model pipeline
model = Pipeline(steps=[('preprocessor', preprocessor),
                        ('classifier', LogisticRegression(random_state=42, max_iter=1000))])
Training Model
model.fit(X_train, y_train)Pipeline(steps=[('preprocessor',
ColumnTransformer(transformers=[('num', StandardScaler(),
Index(['SeniorCitizen', 'tenure', 'MonthlyCharges', 'TotalCharges'], dtype='object')),
('cat',
OneHotEncoder(handle_unknown='ignore'),
Index(['gender', 'Partner', 'Dependents', 'PhoneService', 'MultipleLines',
'InternetService', 'OnlineSecurity', 'OnlineBackup', 'DeviceProtection',
'TechSupport', 'StreamingTV', 'StreamingMovies', 'Contract',
'PaperlessBilling', 'PaymentMethod'],
dtype='object'))])),
('classifier',
LogisticRegression(max_iter=1000, random_state=42))])In a Jupyter environment, please rerun this cell to show the HTML representation or trust the notebook. On GitHub, the HTML representation is unable to render, please try loading this page with nbviewer.org.
Pipeline(steps=[('preprocessor',
                 ColumnTransformer(transformers=[('num', StandardScaler(),
                                                  Index(['SeniorCitizen', 'tenure', 'MonthlyCharges', 'TotalCharges'], dtype='object')),
                                                 ('cat',
                                                  OneHotEncoder(handle_unknown='ignore'),
                                                  Index(['gender', 'Partner', 'Dependents', 'PhoneService', 'MultipleLines',
       'InternetService', 'OnlineSecurity', 'OnlineBackup', 'DeviceProtection',
       'TechSupport', 'StreamingTV', 'StreamingMovies', 'Contract',
       'PaperlessBilling', 'PaymentMethod'],
      dtype='object'))])),
                ('classifier',
LogisticRegression(max_iter=1000, random_state=42))])ColumnTransformer(transformers=[('num', StandardScaler(),
Index(['SeniorCitizen', 'tenure', 'MonthlyCharges', 'TotalCharges'], dtype='object')),
('cat', OneHotEncoder(handle_unknown='ignore'),
Index(['gender', 'Partner', 'Dependents', 'PhoneService', 'MultipleLines',
       'InternetService', 'OnlineSecurity', 'OnlineBackup', 'DeviceProtection',
       'TechSupport', 'StreamingTV', 'StreamingMovies', 'Contract',
       'PaperlessBilling', 'PaymentMethod'],
dtype='object'))])Index(['SeniorCitizen', 'tenure', 'MonthlyCharges', 'TotalCharges'], dtype='object')
StandardScaler()
Index(['gender', 'Partner', 'Dependents', 'PhoneService', 'MultipleLines',
'InternetService', 'OnlineSecurity', 'OnlineBackup', 'DeviceProtection',
'TechSupport', 'StreamingTV', 'StreamingMovies', 'Contract',
'PaperlessBilling', 'PaymentMethod'],
dtype='object')OneHotEncoder(handle_unknown='ignore')
LogisticRegression(max_iter=1000, random_state=42)
Model Evaluation
# Make predictions on the test set
y_pred = model.predict(X_test)

# Print a classification report
print("Classification Report:")
print(classification_report(y_test, y_pred))

# Print the confusion matrix
print("Confusion Matrix:")
print(confusion_matrix(y_test, y_pred))
Classification Report:
precision recall f1-score support
0 0.85 0.89 0.87 1033
1 0.65 0.57 0.61 374
accuracy 0.80 1407
macro avg 0.75 0.73 0.74 1407
weighted avg 0.80 0.80 0.80 1407
Confusion Matrix:
[[917 116]
[160 214]]Feature Importance
# Extract the trained classifier and preprocessor from the pipeline
final_classifier = model.named_steps['classifier']
final_preprocessor = model.named_steps['preprocessor']

# Get the feature names after one-hot encoding
ohe_feature_names = final_preprocessor.named_transformers_['cat'].get_feature_names_out(categorical_features)
all_feature_names = list(numerical_features) + list(ohe_feature_names)

# Get the coefficients from the model
coefficients = final_classifier.coef_[0]

# Create a DataFrame to view the feature importances
feature_importance = pd.DataFrame({'Feature': all_feature_names, 'Importance': coefficients})
feature_importance = feature_importance.sort_values(by='Importance', ascending=False)

print("\nTop 10 Features Increasing Churn Likelihood:")
print(feature_importance.head(10))

print("\nTop 10 Features Decreasing Churn Likelihood (Promoting Retention):")
print(feature_importance.tail(10))
Top 10 Features Increasing Churn Likelihood:
                           Feature  Importance
3                     TotalCharges    0.644014
36         Contract_Month-to-month    0.613846
16     InternetService_Fiber optic    0.590184
32                 StreamingTV_Yes    0.191113
43  PaymentMethod_Electronic check    0.180671
35             StreamingMovies_Yes    0.177076
18               OnlineSecurity_No    0.164459
27                  TechSupport_No    0.142949
14               MultipleLines_Yes    0.088164
0                    SeniorCitizen    0.071011

Top 10 Features Decreasing Churn Likelihood (Promoting Retention):
                                 Feature  Importance
19    OnlineSecurity_No internet service   -0.283724
17                    InternetService_No   -0.283724
31       StreamingTV_No internet service   -0.283724
25  DeviceProtection_No internet service   -0.283724
12                      MultipleLines_No   -0.293470
39                   PaperlessBilling_No   -0.300387
2                         MonthlyCharges   -0.541006
15                   InternetService_DSL   -0.616132
38                     Contract_Two year   -0.779030
1                                 tenure   -1.352313
import seaborn as sns
import matplotlib.pyplot as plt
# Visualize feature importance
plt.style.use('seaborn-v0_8-whitegrid')
top_and_bottom_10 = pd.concat([feature_importance.head(10), feature_importance.tail(10)])
# Add a dummy hue column to use with palette (fixes sns warning)
top_and_bottom_10['dummy_hue'] = top_and_bottom_10['Importance']
plt.figure(figsize=(12, 10))
sns.barplot(
x='Importance',
y='Feature',
data=top_and_bottom_10,
hue='dummy_hue',
palette='coolwarm',
dodge=False,
legend=False
)
plt.title('Top 20 Most Important Features for Predicting Churn', fontsize=16)
plt.xlabel('Coefficient (Importance)', fontsize=12)
plt.ylabel('Feature', fontsize=12)
plt.tight_layout()
plt.show()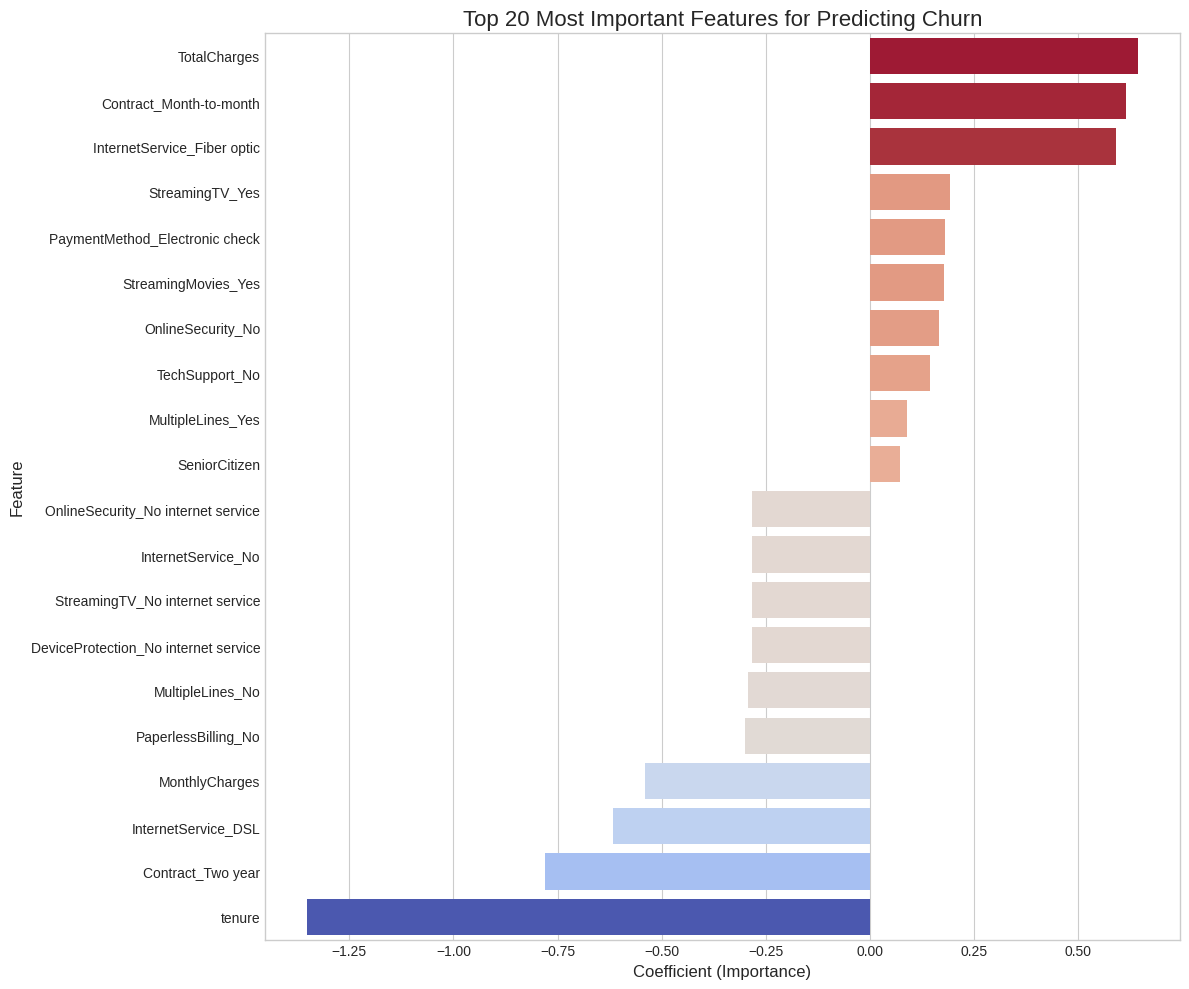
Least Important Features
I calculate the least important features to potentially prune them and simplify the model.
import numpy as np
# Calculate the absolute importance to find features closest to zero
feature_importance['Absolute_Importance'] = np.abs(feature_importance['Importance'])

# Sort by the absolute importance in ascending order
least_important_features = feature_importance.sort_values(by='Absolute_Importance', ascending=True)

print("Features ranked by their impact (least important first):")
# Display all features, starting with the least important
print(least_important_features.to_string())
Features ranked by their impact (least important first):
Feature Importance Absolute_Importance
40 PaperlessBilling_Yes -0.009285 0.009285
26 DeviceProtection_Yes 0.032693 0.032693
8 Dependents_No -0.039151 0.039151
21 OnlineBackup_No 0.043639 0.043639
24 DeviceProtection_No -0.058642 0.058642
23 OnlineBackup_Yes -0.069587 0.069587
0 SeniorCitizen 0.071011 0.071011
14 MultipleLines_Yes 0.088164 0.088164
13 MultipleLines_No phone service -0.104365 0.104365
10 PhoneService_No -0.104365 0.104365
44 PaymentMethod_Mailed check -0.123531 0.123531
6 Partner_No -0.142419 0.142419
4 gender_Female -0.142779 0.142779
27 TechSupport_No 0.142949 0.142949
37 Contract_One year -0.144488 0.144488
42 PaymentMethod_Credit card (automatic) -0.162056 0.162056
18 OnlineSecurity_No 0.164459 0.164459
5 gender_Male -0.166893 0.166893
7 Partner_Yes -0.167253 0.167253
29 TechSupport_Yes -0.168897 0.168897
35 StreamingMovies_Yes 0.177076 0.177076
43 PaymentMethod_Electronic check 0.180671 0.180671
20 OnlineSecurity_Yes -0.190408 0.190408
32 StreamingTV_Yes 0.191113 0.191113
33 StreamingMovies_No -0.203025 0.203025
41 PaymentMethod_Bank transfer (automatic) -0.204755 0.204755
11 PhoneService_Yes -0.205307 0.205307
30 StreamingTV_No -0.217061 0.217061
9 Dependents_Yes -0.270520 0.270520
28 TechSupport_No internet service -0.283724 0.283724
34 StreamingMovies_No internet service -0.283724 0.283724
22 OnlineBackup_No internet service -0.283724 0.283724
17 InternetService_No -0.283724 0.283724
31 StreamingTV_No internet service -0.283724 0.283724
25 DeviceProtection_No internet service -0.283724 0.283724
19 OnlineSecurity_No internet service -0.283724 0.283724
12 MultipleLines_No -0.293470 0.293470
39 PaperlessBilling_No -0.300387 0.300387
2 MonthlyCharges -0.541006 0.541006
16 InternetService_Fiber optic 0.590184 0.590184
36 Contract_Month-to-month 0.613846 0.613846
15 InternetService_DSL -0.616132 0.616132
3 TotalCharges 0.644014 0.644014
38 Contract_Two year -0.779030 0.779030
1 tenure -1.352313 1.352313Pruned Model
# Create a copy to avoid modifying the original DataFrame
data_pruned = data.copy()

# 1. Prune the unimportant features
features_to_drop = ['gender', 'PhoneService', 'Partner']
data_pruned.drop(columns=features_to_drop, inplace=True)
print(f"Dropped columns: {features_to_drop}\n")

# 2. Set up the new feature set and target variable
X_pruned = data_pruned.drop('Churn', axis=1)
y_pruned = data_pruned['Churn']

# Identify column types for the new, smaller dataset
categorical_features_pruned = X_pruned.select_dtypes(include=['object']).columns
numerical_features_pruned = X_pruned.select_dtypes(include=['int64', 'float64']).columns

# 3. Split the pruned data
X_train_p, X_test_p, y_train_p, y_test_p = train_test_split(X_pruned, y_pruned, test_size=0.2, random_state=42, stratify=y_pruned)

# 4. Define a new preprocessor and pipeline for the pruned data
preprocessor_pruned = ColumnTransformer(
    transformers=[
        ('num', StandardScaler(), numerical_features_pruned),
        ('cat', OneHotEncoder(handle_unknown='ignore'), categorical_features_pruned)
    ])

model_pruned = Pipeline(steps=[('preprocessor', preprocessor_pruned),
                               ('classifier', LogisticRegression(random_state=42, max_iter=1000))])

# 5. Train the new model
model_pruned.fit(X_train_p, y_train_p)

# 6. Evaluate the new model's performance
print("Classification Report:")
y_pred_p = model_pruned.predict(X_test_p)
print(classification_report(y_test_p, y_pred_p))
Dropped columns: ['gender', 'PhoneService', 'Partner']
Classification Report:
precision recall f1-score support
0 0.85 0.89 0.87 1033
1 0.65 0.57 0.61 374
accuracy 0.80 1407
macro avg 0.75 0.73 0.74 1407
weighted avg 0.80 0.80 0.80 1407
Save Model
# Save the trained pruned model
model_name = 'churn_model.joblib'
drive_path = f'/content/drive/My Drive/{model_name}'
# Uncomment this if you want the full model
#joblib.dump(model, drive_path)
joblib.dump(model_pruned, drive_path)
print(f"Best model saved to Google Drive at: {drive_path}")
Best model saved to Google Drive at: /content/drive/My Drive/churn_model.joblib